Which States Are Seeing the Fastest Growth in Commercial and Industrial Electricity Demand?
After 15 years of nearly flat U.S. electricity consumption, demand increased by an average of 2.1% per year over the last five years, according to the U.S. Energy Information Administration.
The EIA’s 2026 outlook identifies data center server use as a major factor and projects electricity use in commercial buildings to grow faster than use in the residential or industrial sectors across all modeled cases. Data centers consumed an estimated 4.4% of U.S. electricity in 2023 and could account for 6.7% to 12% by 2028.
Data centers are not the only source of new load. The Department of Energy also points to domestic manufacturing growth and electrification.
Journyx analyzed state-level retail electricity sales to identify where commercial and industrial electricity use changed most between 2015 and 2025. They also analyzed preliminary data from early 2026 to see the most current trends.
Across the 50 states and D.C., commercial electricity sales increased by 9.8% over the decade. Industrial sales increased by 5.6%.
The national totals, however, conceal sharply different state-level patterns.
Key Findings
- North Dakota had the fastest commercial electricity sales growth, rising 83.3% between 2015 and 2025.
- New Mexico led industrial growth, with sales increasing 99.3%.
- Texas recorded the largest absolute increase in both sectors, adding 37.5 million megawatt-hours (MWh) of commercial sales and 64.8 million MWh of industrial sales.
- Commercial sales increased in 30 states. Industrial sales increased in only 20.
- Without Texas, the other 49 states and D.C. combined would have recorded a 9.1 million megawatthour decline in industrial sales.
- Preliminary data for January through April 2026 shows commercial sales running 3.3% above the same period in 2025, compared with 0.4% growth for industrial sales.
About the Analysis
Journyx compared annual commercial and industrial retail electricity sales in 2015 with preliminary annual sales in 2025.
The data comes from the U.S. Energy Information Administration’s state- and sector-level electricity sales series. The EIA reports retail sales in MWh for electricity delivered to ultimate customers.
For this analysis:
- Commercial sales include electricity supplied to offices, stores, hospitals, schools, government buildings, data centers, and other service-providing or institutional customers.
- Industrial sales include electricity supplied to factories, manufacturing plants, refineries, mines, and other facilities that produce, process, or assemble goods.
- Annual retail sales are used as a proxy for annual electricity demand or consumption. They do not measure peak demand.
- The analysis covers the 50 states and the District of Columbia. It excludes the U.S. aggregate.
- States are ranked by percentage change. Absolute change is shown separately because a state can grow quickly from a relatively small starting point without adding the most electricity sales.
- The 2025 annual values are preliminary and may change as the EIA finalizes the data.
- The January–April 2026 comparison uses the same four-month period in each year. Those figures are also preliminary and are not a full-year forecast.
Commercial Electricity Sales Grew in 30 States Over the Past 10 Years
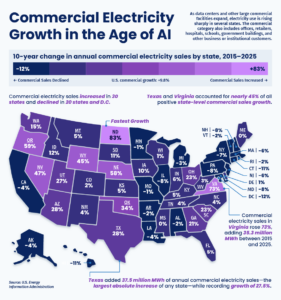
North Dakota recorded the fastest percentage increase in commercial electricity sales.
Sales rose from 6.3 million MWh in 2015 to 11.5 million in 2025, an increase of 83.3%.
Virginia ranked second at 73.0%. Oregon, Nebraska, Nevada, and Wyoming also recorded increases of more than 40%.
Percentage growth does not tell the entire story.
Texas added 37.5 million MWh of annual commercial electricity sales, the largest absolute increase of any state. Virginia followed closely, adding 35.3 million MWh.
Together, Texas and Virginia accounted for 44.6% of all positive state-level commercial sales growth.
States With the Fastest Commercial Electricity Sales Growth
| Rank | State | Change, 2015–2025 | Absolute change |
|---|---|---|---|
| 1 | North Dakota | 83.3% | 5.23 million MWh |
| 2 | Virginia | 73.0% | 35.28 million MWh |
| 3 | Oregon | 59.3% | 9.50 million MWh |
| 4 | Nebraska | 57.8% | 5.38 million MWh |
| 5 | Nevada | 47.2% | 4.54 million MWh |
| 6 | Wyoming | 44.8% | 1.76 million MWh |
| 7 | Oklahoma | 33.8% | 6.99 million MWh |
| 8 | Arizona | 28.2% | 8.26 million MWh |
| 9 | Texas | 27.5% | 37.48 million MWh |
| 10 | Utah | 26.7% | 3.10 million MWh |
Virginia Shows the Data Center Effect
Virginia provides the clearest connection between commercial sales growth and the data center boom.
The state’s commercial electricity sales increased by 35.3 million MWh over the full decade analyzed by Journyx.
Looking at the more recent period from 2019 through 2025, the EIA found that Virginia added nearly 30 million MWh of commercial electricity sales. The agency said the increase was largely driven by the state’s concentration of data centers, along with electric vehicle adoption and building electrification.
The effect is becoming large enough to change the commercial sector nationally. The EIA estimates that servers alone accounted for 7% of commercial-sector electricity consumption in 2025. That figure does not include all of the cooling and other equipment needed to operate data centers.
That does not mean every state with strong commercial growth is experiencing a data center boom.
The commercial category also includes offices, retailers, hospitals, schools, government facilities, warehouses, and other business or institutional customers. The sales data identifies where use changed. It does not identify the cause of every state’s increase.
Commercial Declines Were Concentrated in Other Markets
Commercial electricity sales declined in 20 states and the District of Columbia.
D.C. recorded the steepest percentage decline at 12.2%. Connecticut and Hawaii followed with declines of 11.4% and 11.3%.
New York had the largest absolute decrease, with annual commercial sales falling by 5.1 million MWh. California recorded the second-largest absolute decrease at 4.9 million MWh, despite ranking outside the 10 steepest percentage declines.
States With the Steepest Commercial Electricity Sales Declines
| Rank | State or district | Change, 2015–2025 | Absolute change |
|---|---|---|---|
| 1 | District of Columbia | -12.2% | -1.00 million MWh |
| 2 | Connecticut | -11.4% | -1.48 million MWh |
| 3 | Hawaii | -11.3% | -0.36 million MWh |
| 4 | Pennsylvania | -8.2% | -3.58 million MWh |
| 5 | Maryland | -8.0% | -2.38 million MWh |
| 6 | Illinois | -7.9% | -3.97 million MWh |
| 7 | New Hampshire | -7.6% | -0.34 million MWh |
| 8 | New York | -6.6% | -5.12 million MWh |
| 9 | Massachusetts | -6.1% | -1.60 million MWh |
| 10 | New Jersey | -5.7% | -2.21 million MWh |
Industrial Electricity Sales Declined in Most States Over the Past 10 Years
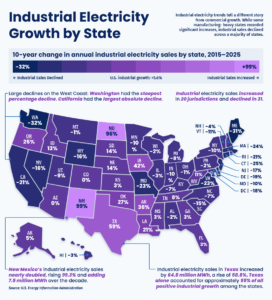
Industrial electricity sales followed a narrower growth pattern.
Sales increased in 20 states. They declined in 30 states and the District of Columbia.
New Mexico recorded the fastest percentage increase. Its annual industrial electricity sales rose from 7.6 million MWh in 2015 to 15.1 million in 2025, an increase of 99.3%.
North Dakota followed at 95.8%.
Texas ranked third by percentage, with growth of 58.8%. Its much larger starting point, however, made it the clear leader in absolute growth.
States With the Fastest Industrial Electricity Sales Growth
| Rank | State | Change, 2015–2025 | Absolute change |
|---|---|---|---|
| 1 | New Mexico | 99.3% | 7.52 million MWh |
| 2 | North Dakota | 95.8% | 6.69 million MWh |
| 3 | Texas | 58.8% | 64.84 million MWh |
| 4 | Iowa | 41.5% | 8.84 million MWh |
| 5 | Arkansas | 36.1% | 5.79 million MWh |
| 6 | Oklahoma | 27.4% | 4.93 million MWh |
| 7 | Oregon | 25.3% | 3.27 million MWh |
| 8 | Louisiana | 20.5% | 7.20 million MWh |
| 9 | Nebraska | 14.4% | 1.53 million MWh |
| 10 | South Dakota | 14.0% | 0.39 million MWh |
Texas Accounted for More Than Half of Positive Industrial Growth
Texas added 64.8 million MWh of annual industrial electricity sales.
That was more than seven times the increase recorded in Iowa, the state with the second-largest absolute industrial gain.
Texas alone accounted for approximately 55% of all positive industrial sales growth among the states.
Its increase was also larger than the net industrial gain across the entire analysis.
Industrial sales across all 50 states and D.C. increased by 55.7 million MWh. Remove Texas, and the other jurisdictions combined recorded a decline of approximately 9.1 million MWh.
The result shows how concentrated industrial growth was.
The Department of Energy identifies domestic manufacturing expansion as one source of the current increase in U.S. electricity demand. Industrial sales can also change with activity at refineries, mines, processing facilities, and other large goods-producing operations. The state-level sales series does not separate those causes.
Washington Had the Steepest Industrial Decline
Washington recorded the largest percentage decline in industrial electricity sales.
Annual sales fell 31.6%, a reduction of 8.5 million MWh.
Maine followed with a decline of 30.5%. Connecticut and Massachusetts each recorded declines of more than 24%.
California had the largest absolute decrease. Its industrial electricity sales fell by 10.8 million MWh, or 20.5%.
States With the Steepest Industrial Electricity Sales Declines
| Rank | State or district | Change, 2015–2025 | Absolute change |
|---|---|---|---|
| 1 | Washington | -31.6% | -8.47 million MWh |
| 2 | Maine | -30.5% | -0.98 million MWh |
| 3 | Connecticut | -25.4% | -0.87 million MWh |
| 4 | Massachusetts | -24.4% | -1.92 million MWh |
| 5 | Missouri | -23.0% | -3.92 million MWh |
| 6 | Virginia | -22.8% | -4.00 million MWh |
| 7 | Rhode Island | -21.4% | -0.17 million MWh |
| 8 | California | -20.5% | -10.78 million MWh |
| 9 | Delaware | -18.8% | -0.46 million MWh |
| 10 | District of Columbia | -17.8% | -0.04 million MWh |
Commercial and Industrial Growth Often Moved in Different Directions
Commercial and industrial electricity sales increased by a combined 188.4 million MWh between 2015 and 2025.
That represents combined growth of 8.0%.
The growth did not follow the same pattern in every state.
| State-level pattern | Number of jurisdictions |
| Commercial and industrial sales both increased | 16 states |
| Commercial and industrial sales both declined | 16 states and D.C. |
| Commercial increased while industrial declined | 14 states |
| Industrial increased while commercial declined | 4 states |
Virginia had one of the clearest splits.
Its commercial electricity sales increased by 35.3 million MWh, while industrial sales declined by 4.0 million. The result was a combined increase of 31.3 million MWh.
Alaska, Arkansas, Louisiana, and Mississippi moved in the opposite direction. Each recorded industrial growth while commercial sales declined.
Texas was the largest combined-growth outlier.
The state added 102.3 million MWh across the two sectors: 37.5 million from commercial customers and 64.8 million from industrial customers. Texas alone accounted for 54.3% of the net combined increase across all states and D.C.
Texas is also central to the next phase of electricity-demand growth because many proposed projects would require unusually large amounts of power.
As of March 26, 2026, ERCOT was tracking approximately 410 gigawatts of proposed large-load interconnection requests. These are requests from facilities seeking to connect substantial new electricity demand to the grid. About 87% of the requested capacity was associated with data centers.
The requests represent proposed projects rather than electricity use from facilities already in operation. However, they show the scale of potential new demand facing the Texas grid.
That pipeline may also point to a larger wave of utility capital expansion as providers build the generation, transmission, distribution, and grid infrastructure needed to connect and serve new loads.
Early 2026 Data Shows Commercial Sales Still Leading
The most recent preliminary monthly data points in the same direction.
Commercial electricity sales across the 50 states and D.C. were 3.3% higher from January through April 2026 than during the same four months of 2025.
Industrial sales were 0.4% higher.
| Sector | January–April change | Absolute change |
| Commercial | 3.3% | 15.2 million MWh |
| Industrial | 0.4% | 1.4 million MWh |
| Commercial and industrial combined | 2.1% | 16.6 million MWh |
Commercial sales increased in 39 states during the four-month comparison.
Nebraska recorded the fastest percentage growth at 17.9%. Ohio followed at 17.8%, Indiana at 17.4%, Arizona at 15.6%, and Rhode Island at 14.4%.
Texas posted the largest absolute commercial increase, adding 3.8 million MWh compared with the first four months of 2025.
Industrial sales increased in 29 states.
New Mexico led by percentage at 14.3%, followed by Alaska at 13.0%, Arkansas at 8.5%, Mississippi at 8.1%, and Nebraska at 7.4%.
Texas again showed why commercial and industrial movement should be examined separately.
Its commercial sales increased by 7.1%, adding 3.75 million MWh. Industrial sales declined by 6.8%, or 3.80 million MWh.
The two changes nearly canceled each other out. Combined commercial and industrial sales in Texas were approximately flat.
The January–April figures are preliminary. Four months of data can be affected by weather, facility schedules, economic conditions, and the timing of new loads. They should not be treated as a forecast for the full year. The EIA publishes the monthly state- and sector-level sales used in this comparison through its EIA-861M series.
Electricity Growth Is Becoming More Concentrated
The state-level results show more than whether U.S. electricity use is rising. They show where that growth is occurring, which sectors are driving it, and how concentrated the increase has become.
Commercial electricity sales grew in 30 states. Much of the absolute increase, however, came from Texas and Virginia.
Industrial growth was narrower. Sales increased in only 20 states, and Texas accounted for a large share of the national gain. Most states recorded an industrial decline even as the overall total increased.
Data centers are an important part of this shift, particularly in Virginia and in the pipeline of proposed large electricity loads seeking to connect to the Texas grid.
They are not the only factor.
Manufacturing investment, electrification, population and business growth, facility openings and closures, and changes in energy-intensive industries can all affect state electricity sales.
For utilities, these regional differences matter. Growth concentrated in a small number of states can change where new generation, transmission, distribution infrastructure, crews, contractors, and project resources are needed.
The next phase of electricity-demand growth will depend heavily on where large commercial and industrial projects move forward, and whether local grids are prepared to serve them.
Source: Journyx analysis of U.S. Energy Information Administration retail electricity sales data. Annual 2025 values and January–April 2026 values are preliminary and subject to revision.
Fair Use
You are welcome to use, reference, and share non-commercial excerpts of this study with proper attribution. If you cite or cover our findings, please link back to this page so readers can view the full methodology, charts, and context.




Book a Demo Today.
Labor intensive business? Manage cost allocation and budget control, regulatory compliance audits, field management, workforce optimization, along with risk management and response with time tracking from Journyx.